Here is a claim that can be tested against data: when a productivity leap concentrates economic gains faster than a society's institutions can redistribute them, the resulting pressure creates conditions under which political instability becomes significantly more likely. This is not a prediction of war. It is a structural observation about the relationship between technology, inequality, and institutional capacity — and every major data series available in 2025 suggests the United States is deep inside one of these periods.
I. The Mechanism: How a Productivity Leap Becomes an Inequality Spike
We begin with a first-principles question: why does new technology widen inequality? The most durable answer comes from the economist Simon Kuznets, who proposed in 1955 that productivity transformations follow a predictable arc. In the early phase, a few actors — those with capital, technical knowledge, or early access — capture outsized returns. Workers in older industries see stagnant or declining real wages. The income distribution stretches. This is not corruption or conspiracy; it is the mechanical consequence of differential access to a new means of production.
Kuznets argued that eventually the arc bends: labor markets adjust, education systems retool, political institutions redistribute, and inequality falls. The pattern traces an inverted U.
But here is the critical distinction that shapes everything that follows: the rising phase is automatic. The falling phase is not. Markets concentrate gains by default. Dispersing them requires conscious institutional action — progressive taxation, labor protections, public investment, antitrust enforcement. This means the Kuznets curve only bends downward when specific institutional conditions are met. When those institutions are weak, absent, or captured by the beneficiaries of the rising phase, the curve continues to climb.
This reframes the core question. The issue is not whether AI will increase productivity — it will. The issue is whether the institutional architecture required to distribute those gains still exists in sufficient strength.
The data say it does not.
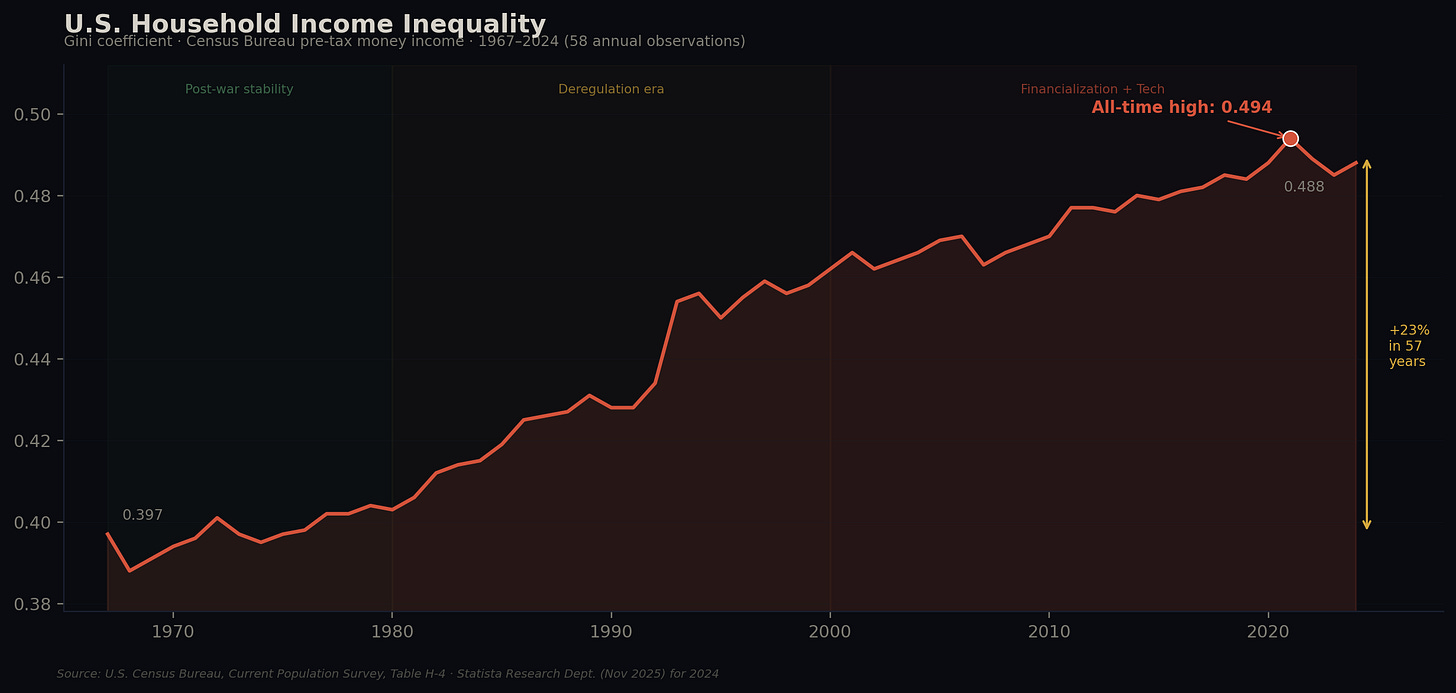
The Census Bureau’s Gini coefficient for household income — the standard measure of income distribution — has climbed for more than half a century. It stood at 0.397 in 1967, rose through the deregulation era to 0.462 by 2000, and crested at an all-time high of 0.494 in 2021. The most recent reading, 0.488 in 2024 (Census Bureau P60-286, September 2025), represents a marginal dip from the peak — but still sits higher than at any point before 2020. This is not a curve that is bending downward. It is a curve that has plateaued at the summit.
That observation leads directly to the next question: if the income Gini is near its ceiling, what does the wealth picture look like?
II. The Depth: Why the Wealth Gap Amplifies Every Tech Boom
Income is what people earn in a given year. Wealth is what they accumulate over a lifetime — and wealth inequality is far more extreme than income inequality suggests. This matters for our argument because the mechanism through which AI concentrates gains operates primarily through asset ownership, not wages.
Here is the structural reason. The top 1% of U.S. households hold their wealth disproportionately in corporate equities and private business stakes — the asset classes that appreciate fastest during technological booms. The bottom 50% hold theirs primarily in real estate (roughly half of their total assets) and carry proportionally more debt. This means every technology-driven market rally mechanically widens the wealth gap, even without any change in policy, wages, or tax rates. The market itself is a concentration engine.
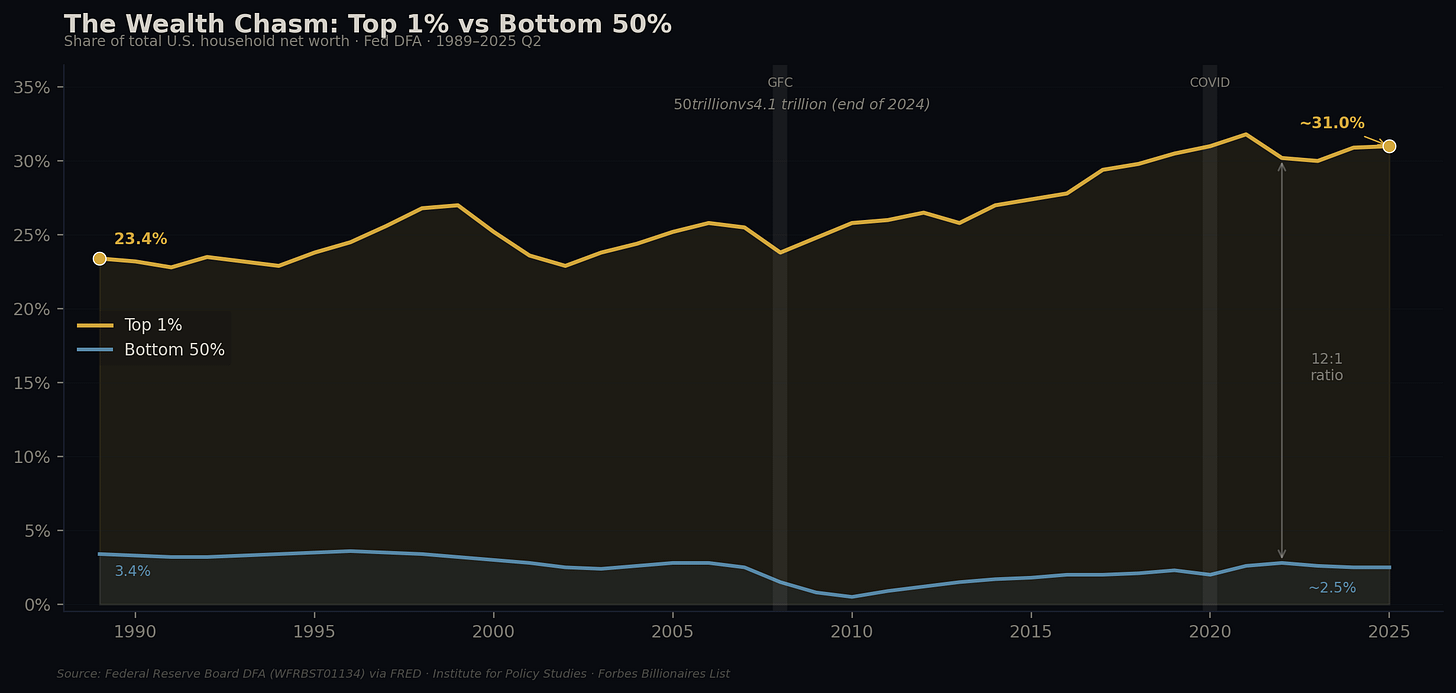
The Federal Reserve’s Distributional Financial Accounts measure the result. In 1989, the top 1% held 23.4% of all household net worth. By Q3 2025, their share had climbed to 31.7% — approximately $52 trillion out of a total wealth pool of about $164 trillion (Fed DFA/FRED: WFRBST01134, updated January 2026). During the same period, the bottom 50% of households — 66 million families — saw their share shrink from 3.4% to 2.5%, holding just $4.1 trillion combined. Today, 905 American billionaires collectively hold more wealth than that entire bottom half.
This chart also reveals something important about timing. Notice that the top 1%’s share accelerates after 2015, coinciding with the tech and AI investment boom. The dot-com era (late 1990s) and the pre-GFC bubble (mid-2000s) produced temporary spikes that corrected downward. The current concentration shows no such correction. It has become structural rather than cyclical.
Now apply this to AI specifically. Large language models and generative AI tools are overwhelmingly owned by a handful of companies. As these tools automate cognitive tasks — displacing lawyers, analysts, programmers, content creators — the resulting productivity gains flow almost entirely to equity holders. The workers being displaced do not own the machine that replaces them. This is the Kuznets concentration mechanism operating at digital speed, through the asset channel rather than the income channel.
The next question follows logically: if the problem is that institutions are failing to redistribute, how badly have those institutions actually deteriorated?
III. The Rust: Why the Redistribution Machinery Is Broken
The postwar United States possessed a powerful set of institutional tools for bending the Kuznets curve downward. The New Deal had established a framework of progressive taxation, labor rights, and financial regulation. Unions represented over a third of the workforce and wielded significant political power. The top marginal income tax rate exceeded 90% through the Eisenhower era. These were the mechanisms that compressed inequality from the 1930s through the 1970s — the period economists call the Great Compression.
Every one of these mechanisms has been systematically weakened.
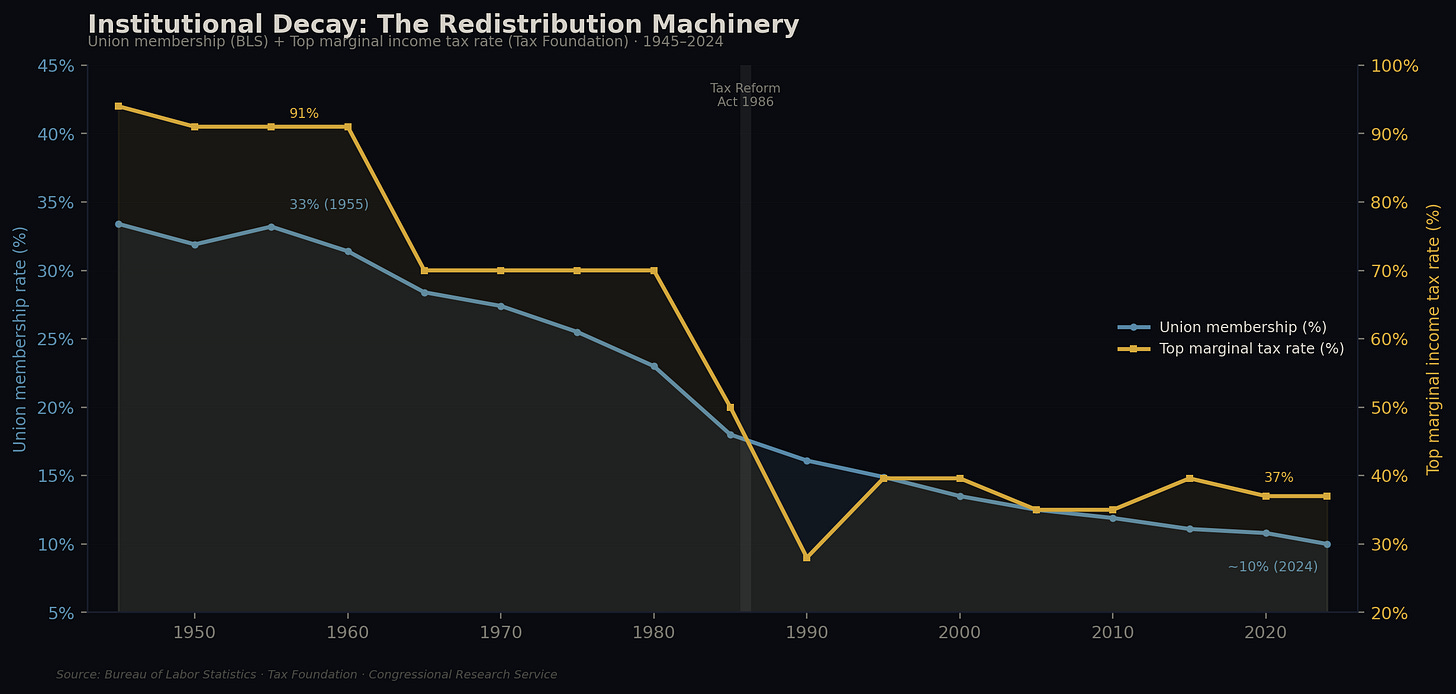
Union membership has fallen from 33% in 1955 to roughly 10% in 2024. The top marginal income tax rate dropped from 91% in the 1950s to 70% in the 1970s, then plunged to 28% after the Tax Reform Act of 1986, and sits at 37% today. Antitrust enforcement, after decades of permissive doctrine, is only beginning to stir. Financial regulation, partially restored after 2008, is being rolled back again. The institutional infrastructure that once translated productivity gains into broadly shared prosperity has rusted in place.
This is not a story about partisan politics. The decline in union density and marginal tax rates occurred across both Democratic and Republican administrations, driven by globalization, deregulation ideology, and the political influence of concentrated capital. The result is bipartisan: the machinery of redistribution is weakest at precisely the moment — on the threshold of the AI transformation — when it is needed most.
This establishes the structural condition. But structural conditions alone do not produce crises. The question becomes: at what point does accumulated pressure actually become dangerous?
IV. The Pressure Gauge: When Does Inequality Become Instability?
Many highly unequal societies persist for decades without political breakdown. Brazil, South Africa, and much of Latin America endure Gini coefficients far higher than America’s. Inequality is a necessary condition for the type of instability we are discussing, but not a sufficient one. Something more specific must be identified.
This is the contribution of Peter Turchin’s Structural-Demographic Theory. In 2010, Turchin published a brief, arresting forecast in the journal Nature: the coming decade would bring growing political instability to the United States and Western Europe. At the time, this sounded contrarian. The economy was recovering. Institutions appeared intact. Fourteen years later, the prediction looks precise.
Turchin’s framework identifies not one but three forces that, when they intensify simultaneously, push societies into crisis zones:
Mass immiseration — stagnating or declining real living standards for ordinary people. Since 1979, economy-wide productivity has grown roughly 3.5 times faster than typical worker compensation (EPI, 2025 update). The gap represents gains captured by capital, not labor.
Intra-elite competition — too many aspirants for too few positions of power and prestige. This is the most counterintuitive but historically the most dangerous force. Revolutions are not led by the destitute. They are led by downwardly mobile professionals — frustrated lawyers, displaced bureaucrats, radicalized students. The French Revolution’s leaders were lawyers and minor nobles. The 1960s radical movements recruited from campus, not from factories.
State weakness — fiscal strain, declining institutional legitimacy, and erosion of governance capacity. Trust in the federal government has fallen from 77% in 1964 to just 17% as of September 2025 (Pew Research Center). Congress’s approval rating hovers near single digits.
Turchin’s Political Stress Index (PSI) synthesizes these three into a composite measure. Applied to American history, it reveals peaks that align with the Civil War era of the 1860s — and, on the projected curve, with the present decade. His 2010 forecast of “turbulent twenties” has been validated by the escalation of political violence, institutional distrust, and polarization since 2020.
“Quantitative historical analysis reveals that complex human societies are affected by recurrent — and predictable — waves of political instability.” — Peter Turchin, Nature (2010)
Here is the direct connection to AI. In 2025, Turchin has pointed to artificial intelligence as an accelerant of the second force — elite overproduction. AI is not displacing agricultural workers or factory hands. It is displacing knowledge workers: legal analysts, financial modelers, software engineers, journalists, medical diagnosticians. These are precisely the credentialed, ambitious professionals who, when blocked from advancement, become the recruitment pool for radical counter-elite movements. History’s most dangerous instability does not emerge from poverty. It emerges from frustrated expectations among the educated.
This raises a final structural question: even if the pressure is building, does the state have the fiscal and institutional capacity to respond before it becomes uncontainable?
V. The Shrinking Room: Can the State Respond?
Every historical case in which the Kuznets curve bent downward peacefully shares a common feature: the state had sufficient fiscal capacity to act. The New Deal was launched when federal debt was roughly 40% of GDP. Britain’s postwar welfare state was built with strong revenue growth. Western Europe’s social democracies were constructed during decades of rapid economic expansion. The margin for institutional response was wide.
That margin has nearly disappeared.
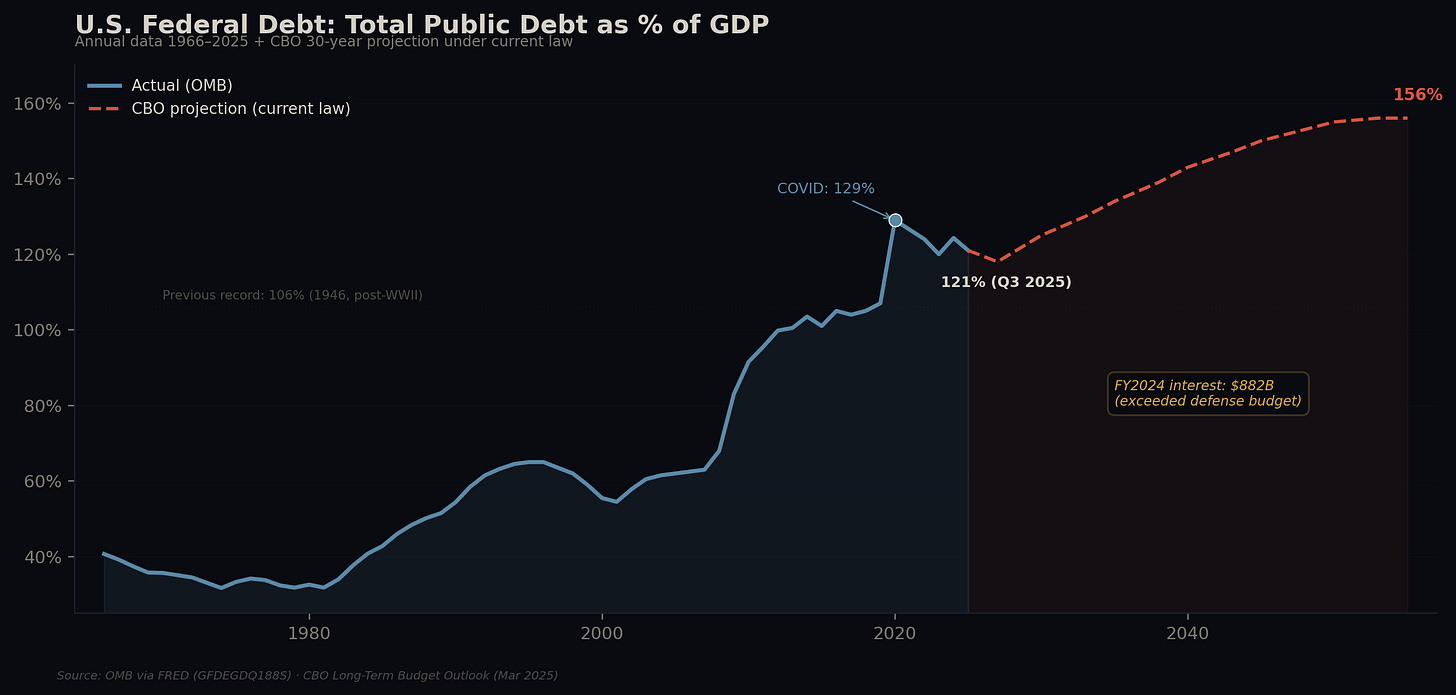
Total federal public debt stands at approximately 121% of GDP as of Q3 2025, surpassing the post-WWII record of 106%. The Congressional Budget Office projects it will reach 156% by 2055 under current law. Interest payments alone consumed $882 billion in fiscal year 2024 — more than the entire defense budget. The annual deficit runs at $1.83 trillion (FY2024) with no plausible path to balance.
Ray Dalio’s framework in Principles for Dealing with the Changing World Order provides the wider context. Studying 500 years of great-power transitions, Dalio identifies roughly 18 determinants of national power — innovation, education, military strength, trade, financial center status, reserve currency share, and critically, fiscal health. Empires rise when these dimensions reinforce one another and decline when they decouple. The United States in 2025 remains dominant in technology and military capacity, but on fiscal health, institutional trust, and social cohesion, the trajectory is unambiguously downward.
The dollar’s share of global central bank reserves has declined from roughly 72% in 2000 to around 58% today — still dominant, but the trend erodes the one structural advantage that has allowed the U.S. to sustain deficits that would bankrupt other nations. Dalio warns that reserve currency erosion lags other indicators by decades, creating a false sense of security until the margin vanishes.
The implication is stark: the government that would need to fund massive retraining programs, expand social insurance, invest in public goods, and restructure the tax code during the AI transition is the same government that cannot fund its existing obligations. The state that should be the solution is itself part of the problem.
This leads to the historical question: what happened the last time all these forces converged?
VI. The Precedent: What Happened Last Time
The historian Walter Scheidel documented an uncomfortable regularity in his 2017 book The Great Leveler: across millennia, the most effective mechanisms for reducing extreme inequality have been catastrophic violence — war, revolution, state collapse, and pandemic. Peaceful redistribution, while possible, has been the historical exception.
The 20th century provides the clearest case study.
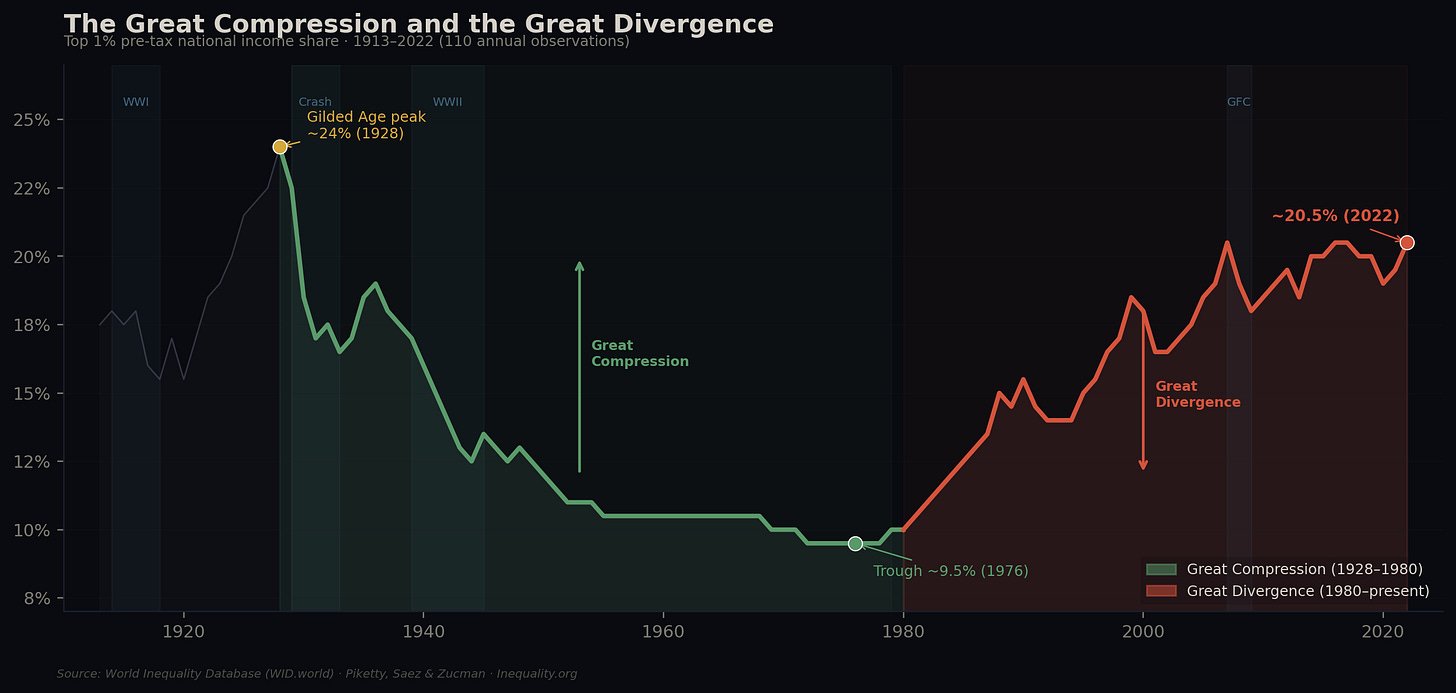
In the decades before World War I, inequality in the United States reached levels strikingly similar to today. The top 1%’s share of national income peaked at roughly 24% by 1928. Then came the combined shocks of the Great Depression and the Second World War: physical destruction of capital stock, confiscatory wartime taxation (top rates exceeding 90%), the political empowerment of organized labor, the GI Bill, and the construction of the modern welfare state. By the mid-1970s, the top 1%’s income share had fallen to around 9.5%. This was the Great Compression — the most egalitarian era in modern American history.
Since 1980, every gain of the Great Compression has been reversed. The top 1%’s income share has climbed back to approximately 20.5% by 2022, nearly matching its pre-Depression peak. This reversal — the Great Divergence — tracks almost perfectly with the institutional decay documented in Section III: falling union membership, lower top tax rates, deregulated finance, weakened antitrust.
The chart tells a symmetrical story. Fifty years of compression, then forty-five years of divergence. The pendulum has swung almost all the way back.
It is essential to be precise about what this history tells us and what it does not. It does not tell us that productivity leaps mechanistically cause wars. The IT revolution of the 1990s coincided with declining global conflict. Not every period of inequality produces violence. The relationship between disruption and conflict is mediated by institutional quality, political leadership, and contingent events.
What the pattern does tell us is that when concentration persists for decades, when institutional channels for redistribution are blocked, and when fiscal capacity to respond is constrained, the pressure tends to find outlets that are violent rather than orderly. The longer the pressure accumulates without institutional release, the higher the probability that the eventual correction is catastrophic.
VII. The AI Variable: Why This Cycle May Be Faster
If the preceding sections establish the general pattern — productivity leap → concentration → institutional failure → accumulating pressure → elevated risk — the question becomes: what is specific to AI that might compress this cycle?
Four features distinguish the current transition.
Speed. The steam engine took roughly 80 years to fully diffuse across the British economy. Electrification required 40 years. The internet took 20. Large language models went from research curiosity to workplace deployment in approximately three years. The gap between disruption and adaptation is shrinking at the very moment that adaptive institutions are weakest.
Target. Previous automation waves hit manual labor — textiles, agriculture, assembly lines. Workers displaced from factories could, in principle, move to services. AI targets cognitive labor: legal analysis, financial modeling, software development, medical diagnosis, content creation, customer service. This is not a displacement of the economic margins. It is a displacement of the professional core — the exact population that, per Turchin, becomes politically volatile when its path to status is blocked.
Concentration of returns. Training a frontier AI model now costs upward of $100 million, creating natural oligopolies. A handful of companies and their largest shareholders are capturing gains that dwarf those of previous technology cycles. Seven technology firms now represent over 30% of S&P 500 market capitalization. The wealth-concentration mechanism described in Section II is running at unprecedented speed and scale.
Fiscal constraint. The New Deal was launched at 40% debt-to-GDP. Today’s 121% — heading toward 156% — constrains the very redistribution mechanisms that historical precedent says are necessary. Each dollar spent on debt service is a dollar not available for retraining, education, infrastructure, or social insurance. The escape hatch is narrowing as the need for it grows.
Any one of these factors alone would warrant concern. In combination, they suggest that the AI transition is compressing into a single decade a process that historically unfolded over half a century — and doing so while every institutional buffer is at its weakest point in the postwar era.
Conclusion: The Window Is Open, Not Closing
It would be a mistake to conclude from this analysis that crisis is inevitable. Determinism is the refuge of those who have given up on agency. The pattern described here is real, but so is the counter-pattern: the historical cases in which societies navigated technological transitions without catastrophe.
Britain avoided revolution in the 1830s through the Reform Acts. The United States absorbed the shock of industrialization through the Progressive Era and the New Deal. Postwar Europe built welfare states that delivered decades of shared prosperity. In each case, the key variable was not the technology itself but the speed and adequacy of the institutional response — a willingness, sometimes forced by crisis and sometimes motivated by foresight, to renegotiate the social contract before the pressure became uncontainable.
Tax codes, labor law, education systems, antitrust enforcement, and social safety nets are all technologies — institutional technologies designed to distribute the gains of material technologies. When material technology leaps ahead while institutional technology stagnates, the gap between them becomes the space in which instability grows.
The historical record is unambiguous on one point: this gap has a shelf life. The window for institutional adaptation is measured not in decades but in years. Whether that window is used to redesign the social contract — through updated taxation, portable benefits, public investment in human capital, democratic governance of AI deployment — or whether it is squandered in partisan paralysis, will determine whether the AI era’s signature achievement is shared prosperity or another entry in Walter Scheidel’s long catalogue of violent corrections.
AI is not the enemy. It is a tool of extraordinary productive potential. But the societies that will benefit from it are the ones that move fastest to update the institutional software that governs how the gains are shared. The clock is the same one it has always been: the gap between the speed of disruption and the speed of adaptation.
That gap is widening.
Data Sources & Methodology
Gini coefficient: U.S. Census Bureau, Current Population Survey, Annual Social and Economic Supplement (CPS ASEC), P60-286 (September 2025), pre-tax money income, 1967–2024. 2021 peak: 0.494; 2024: 0.488.
Top 1% wealth share: Federal Reserve Board, Distributional Financial Accounts (WFRBST01134) via FRED, Q3 2025: 31.7% (updated January 16, 2026). Net worth level Q2 2025: $51.85 trillion.
Bottom 50% wealth share: Federal Reserve Board DFA via FRED; IPS analysis.
Federal debt/GDP: Office of Management and Budget and Federal Reserve Bank of St. Louis via FRED (GFDEGDQ188S), Q3 2025: 121.03% (updated January 22, 2026); CBO, Long-Term Budget Outlook (March 2025); CBO, The Budget and Economic Outlook: 2025–2035 (January 2025).
Federal interest payments: Treasury Monthly Statement (FY2024); Committee for a Responsible Federal Budget analysis (November 2024). FY2024 net interest: $882 billion, exceeding defense spending ($872 billion). FY2024 deficit: $1.83 trillion.
Top 1% income share: World Inequality Database (WID.world); Piketty, Saez & Zucman historical estimates; Inequality.org.
Union membership: Bureau of Labor Statistics, Union Members Summary, 1945–2024.
Top marginal tax rate: Tax Foundation, Federal Individual Income Tax Rates History; Congressional Research Service.
Government trust: Pew Research Center, “Public Trust in Government: 1958–2025” (December 4, 2025). 1964: 77%; September 2025: 17%.
Productivity vs. compensation: Economic Policy Institute, The Productivity–Pay Gap and State of Working America Wages (2025 updates). Since 1979, economy-wide productivity has grown approximately 3.5 times faster than typical worker compensation.
Turchin PSI: Turchin, “Modeling Social Pressures Toward Political Instability,” Cliodynamics 4.2 (2013); Goldstone & Turchin, “Welcome to the Turbulent Twenties,” Noema (Sep 2020); Turchin, Ages of Discord (2016). Note: PSI is a composite index and does not use a fixed standardized numerical scale.
Dalio framework: Principles for Dealing with the Changing World Order (2021). USD reserve share from IMF COFER data.
Scheidel: The Great Leveler: Violence and the History of Inequality from the Stone Age to the Twenty-First Century (2017).
All data verified as of February 2026. Charts reconstructed from published primary sources; consult sources above for exact figures.